Compare Two Semester Plans With Credit-Weighted GPA
Model a retake-free semester scenario with credit weights, quality points, and clear assumptions about institutional rules.
A semester with more courses does not automatically move your cumulative GPA more. The credit weights and expected grade points matter. This guide compares two illustrative plans using a conventional 4-point model. It does not predict your grades or replace school policy: retakes, pass/fail courses, and institution-specific scales can change the calculation.
Convert the starting record into quality points
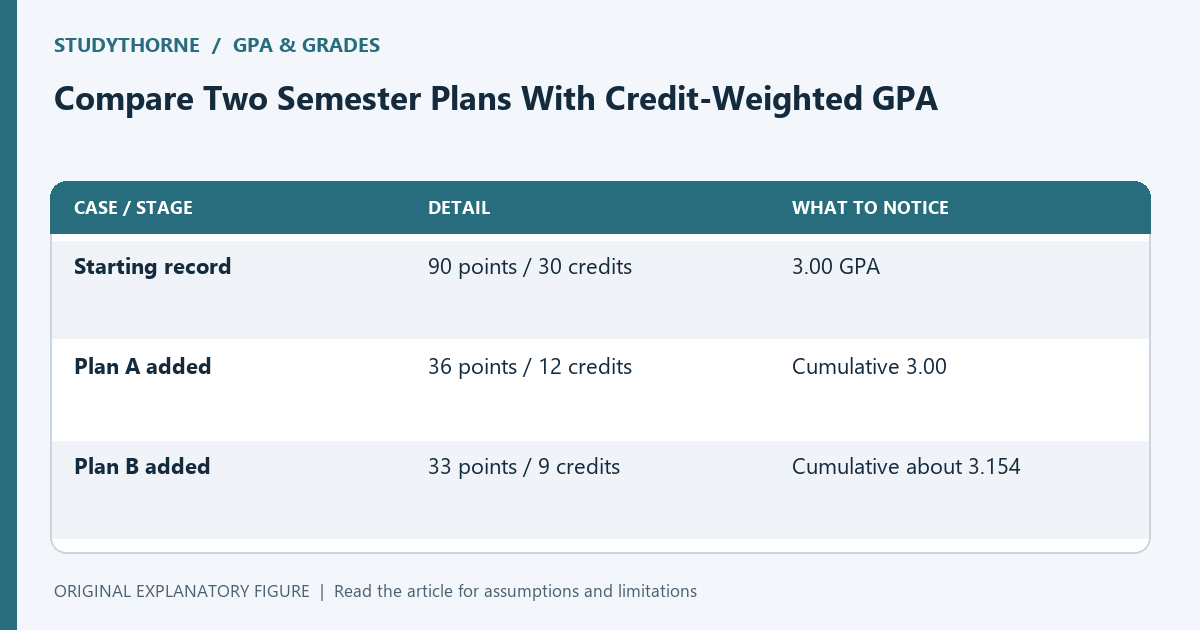
Suppose your current cumulative GPA is 3.00 across 30 GPA-bearing credits. That corresponds to 90 quality points: 3.00 × 30. Use the credits actually included in your school’s GPA calculation, not every credit on the transcript.
Keep full precision when available. A transcript displaying two decimals may hide additional internal precision. If your result differs slightly from an official figure, check the school’s calculation and rounding rules before assuming either the transcript or your arithmetic is wrong.
Describe each plan course by course
Plan A has four 3-credit courses, with illustrative grade points of 4, 3, 3, and 2. Its semester quality points are 12 + 9 + 9 + 6 = 36 across 12 credits. Plan B has three 3-credit courses at 4, 4, and 3, giving 33 quality points across 9 credits.
The grade values are scenarios, not promises. Label them clearly and keep workload decisions separate from expected academic outcomes. A smaller plan may leave more practice time, but this arithmetic cannot establish what grades that time will produce.
Calculate the cumulative results
For Plan A, add 36 to the original 90 quality points and 12 to the original 30 credits. The result is 126 / 42 = 3.00. For Plan B, the result is 123 / 39, approximately 3.154.
Plan B has fewer credits but a higher hypothetical semester average, so it increases the cumulative figure in this comparison. The example demonstrates weighting, not a general rule that fewer courses are better. Change the scenario grades and the comparison can change.
Run a less optimistic case
Replace one expected 4 in Plan B with 3. That removes 3 quality points, producing 120 / 39, approximately 3.077. Comparing both cases shows how sensitive the plan is to a single course result.
Also check degree-progress requirements, prerequisites, and any minimum enrollment rules through your institution. GPA arithmetic alone cannot decide whether a plan fits your program. List these constraints beside the numerical comparison so a favorable GPA scenario does not obscure another requirement.
Use the comparison for a concrete conversation
Enter the credit-weighted courses into the GPA calculator, then compare the result with your hand calculation. Keep a copy of the assumptions and questions about excluded credits or retake treatment for an adviser.
A useful planning conversation asks which plan is feasible, which courses unlock later requirements, and what support is available. Treat the modeled GPA as one input. Recalculate when the course list changes, and never present scenario grades as an official forecast of your transcript.
| Case or stage | Detail | What to notice |
|---|---|---|
| Starting record | 90 points / 30 credits | 3.00 GPA |
| Plan A added | 36 points / 12 credits | Cumulative 3.00 |
| Plan B added | 33 points / 9 credits | Cumulative about 3.154 |